
Top 10 Cities in Los Angeles County with the Highest Drunk Driving Death Rates
Drunk driving related crashes kill 30 people in the U.S. every day, that’s an average of one person every 48 minutes.
Fortunately, 2017 saw a 63% drop in alcohol-related crashes in LA County but this does not make it any less of a problem for families and loved ones of people killed in drunk driving accidents.
Which cities in Los Angeles County have the highest rates of death in drunk driving related accidents? To find out, we analyzed drunk driving related crash data between 2012 and 2017 for cities in Los Angeles County with 50,000 or more residents.
Additionally, from this
Our goal?
To determine the top ten cities with the highest fatality rates per 100K residents. Take a closer look at the top ten list.
[RANKED] Cities With the Highest Alcohol-Related Deaths
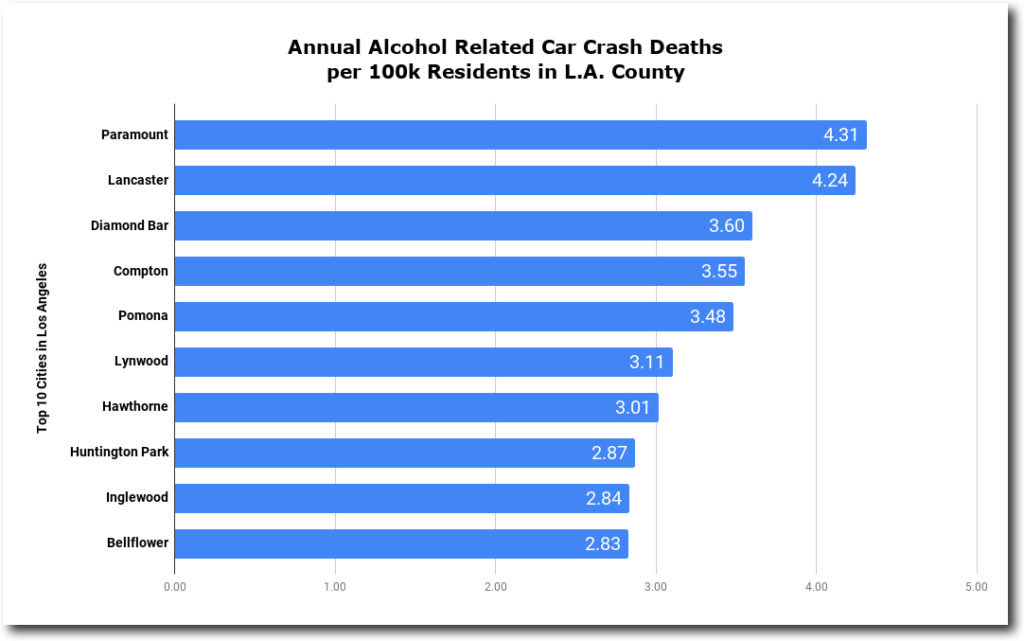
# 1 Paramount
Drunk driving deaths per 100k: 4.34
Paramount ranks as the #1 as the most dangerous city in LA County for drunk driving. With a population of just over 54,000, Paramount is the 3rd smallest city in LA county and the smallest city on our list. Despite its relatively small population, Paramount averages 21 drunk driving crashes per year, with 2 fatalities and 30 injuries as a result of these alcohol-related accidents.
#2 Lancaster
Drunk driving deaths per 100k: 4.24
Lancaster comes in as the second most dangerous city in LA County for drunk driving fatalities. A city of 161,103 residents, it is the largest on our list and almost 3 times the size of Paramount. The city averages 7 fatalities per year from alcohol-related crashes. This is the highest number of deaths for any city on the list. Lancaster also saw a total of 83 drunk driving accidents resulting in 128 injuries per year.
#3 Diamond Bar
Drunk driving deaths per 100k: 3.60
Approximately 30 miles due east of the city of Los Angeles is Diamond Bar with a population of 55,544. Diamond Bar is only slightly larger than our #1 city and is the 3rd most dangerous for drunk driving. Diamond Bar averages 29 DUI crashes per year resulting in 2 fatalities and 40 injuries per year.
# 4 Compton
Drunk driving deaths per 100k: 3.55
On the south side of LA County, we find Compton. It comes in as #4 on our list, near the middle in both alcohol-involved crashes and population size. With 98,462 people, Compton sees an average of 36 average drunk driving crashes per year resulting in 4 deaths and 45 injuries.
# 5 Pomona
Drunk driving deaths per 100k: 3.48
Pomona, neighbor to #3 Diamond Bar is the 2nd largest city on the list with 153,266 people. Pomona residents see an average of 102 drunk driving crashes per year. This city in east LA County also averages 5 fatalities per year and 143 injuries, the highest number of total crashes and injuries out of all the cities on the list.
# 6 Lynwood
Drunk driving deaths per 100k: 3.11
# 6 on our list is Lynwood. This city is Compton’s northern neighbor and has a population of 69,772. In Lynwood 43 injuries and 2 fatalities can be attributed to the 28 average drunk driving crashes seen in the city per year.
# 7 Hawthorne
Drunk driving deaths per 100k: 3.01
Heading west from Lynwood, we come to #7, Hawthorne. With 88,451 residents, the city reports an average of 57 drunk driving crashes per year. Out of these accidents come 3 fatalities and 78 injuries each year of the study data.
# 8 Huntington Park
Drunk driving deaths per 100k: 2.87
Huntington Park is only slightly larger than the #1 city of Paramount with 58,114 residents. Coming in at # 8 on our list, Huntington park reports 37 drunk driving crashes, 2 fatalities and 49 injuries on average per year.
#9 Inglewood
Drunk driving deaths per 100k: 2.84
Hawthorn's northern neighbor, Inglewood is #9 on our list. With a population of 111,666, this city is one of the three largest in LA county. It averages 3 fatalities and 63 injuries in 48 crashes involving alcohol each year.
# 10 Bellflower
Drunk driving deaths per 100k: 2.83
Our final city, Bellflower takes the #10 spot. Another mid-sized city in Los Angeles County, it has a population of 76,616. 35 DUI related crashes in Bellflower leave an average of 2 people dead and 45 injured each year.
Key Findings:
- The city of Los Angeles saw the biggest jump in alcohol-related deaths between 2015-2016, witnessing a +27.5% increase
- Additionally, the city of Los Angeles also saw a -62.75% decrease that following year.
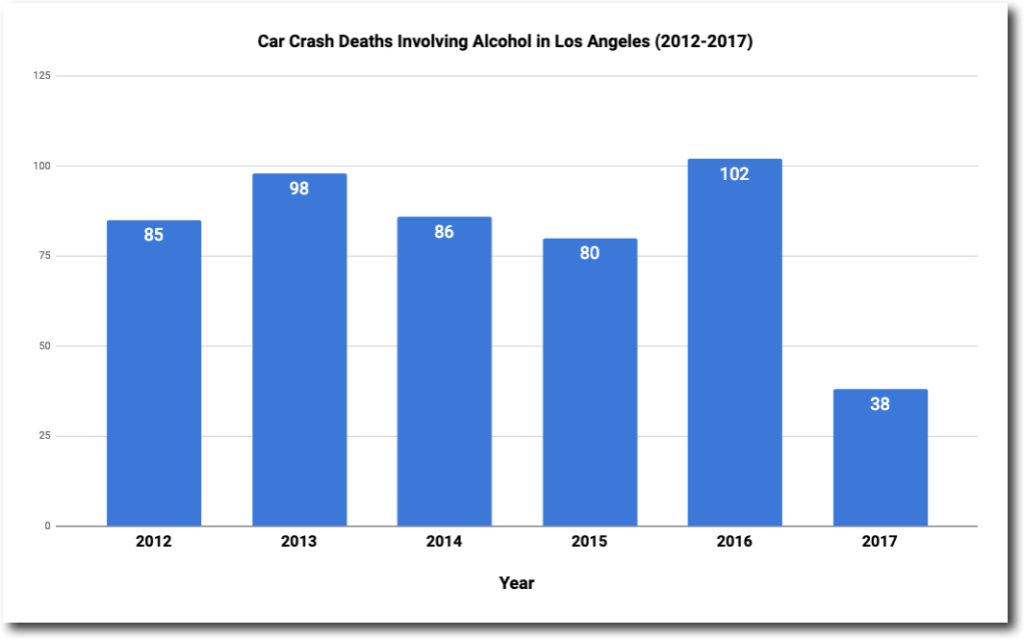
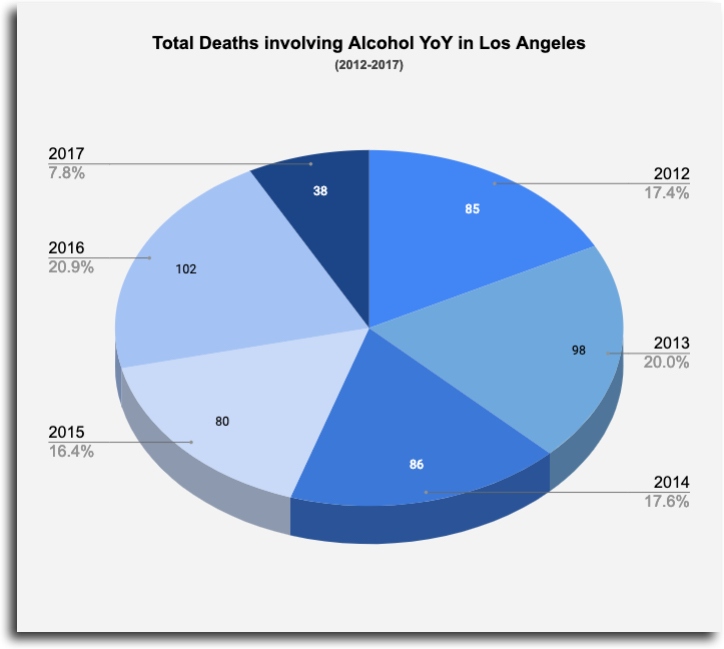
- As you can see, alcohol-related deaths in Los Angeles remained steady throughout the years but then saw a dramatic decrease the last year data was available
- 2012 - 2013: ⇡ 15.3% car crash deaths
- 2013 - 2014: ⇣ 12.25% car crash deaths
- 2014 - 2015: ⇣ 7.0% car crash deaths
- 2015 - 2016: ⇡ 27.5% car crash deaths
- 2016 - 2017: ⇣62.75% car crash deaths
Cities With the LOWEST Alcohol-Related Accidents
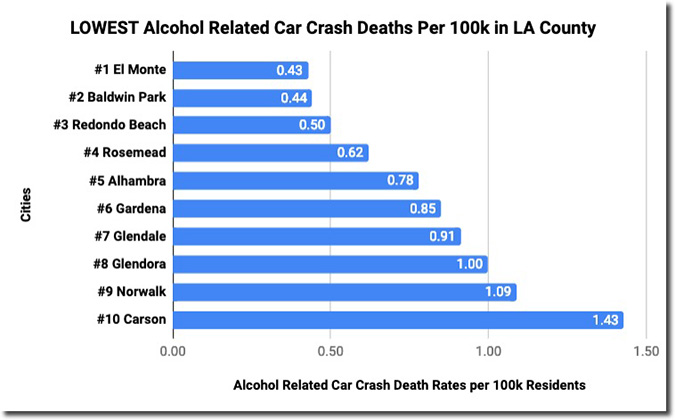
In addition, we also wanted to show the results for the cities in LA County with the LOWEST cities with alcohol-related car crashes in Los Angeles County.
So, that makes us wonder about the million-dollar question; what did the largest city in Los Angeles do differently than the other cities found within our study?
Do you think there is a reason
for why we saw such a dramatic decrease in alcohol-related deaths in 2017?We want to hear from you!
Email Us
Study Methodology
- Los Angeles crash data for all alcohol-related crashes between 2012 and 2017 was obtained from the Transportation Injury Mapping System database
- Our list of cities was narrowed down to those with a population of more than 50,000 people.
- The average number of drunk driving fatalities per year was calculated, per city between 2012 and 2017.
- The formula used to determine the number of drunk driving fatalities each year, per 100k people was: Average annual drunk driving fatalities ÷ (total population ÷ 100,000) = Drunk driving fatalities per 100k

Aidin Ghavimi
Aidin is a partner at Starpoint LC, Attorneys at Law, and focuses on personal injury and employment law cases in and around Southern California. He earned his Juris Doctorate from the Loyola School of Law and his Bachelor’s from USC. Aidin’s primary goal is to bring justice to his clients and to ensure they are able to move on with their lives after a serious injury.